
Operators with active businesses that need to improve profitability, processes, reporting or experience.
Service 05
Optimisation and transformation
Improvement of revenue, productivity, costs, pricing, customer experience, reporting and profitability by activity.
Executive summary
What this service helps decide
When sales, costs, occupancy or operating routines do not sufficiently explain performance.
Improvement diagnosis, intervention priorities, indicators and follow-up plan.
Increase revenueReduce frictionImprove productivityChange mix
01Diagnosis
02Model
03Plan
04Decision
011. Strategic introduction
Optimisation addresses active leisure businesses that need to improve revenue, margin, productivity, customer experience or management control.
022. Client profile
Operators, investors and teams running existing leisure units with performance gaps or insufficient systems.
033. When to use it
When revenue exists but expected profitability, process quality, pricing discipline or customer experience are not yet achieved.
044. Problems solved
Weak profitability visibility, unstructured pricing, low labour productivity, poor purchasing control, weak sales processes and incomplete reporting.
055. Scope
Commercial and operating audit, revenue analysis, pricing, cost/productivity review, customer experience, purchasing, indicators, improvement plan and executive follow-up.
066. Methodology
Available data, operating observation and interviews are combined to separate symptoms from causes and prioritise actions by impact, effort, urgency and risk.
077. Variables analysed
Revenue by line, average ticket, sales mix, occupancy, redemption, labour cost, rent, F&B margin, conversion, recurrence, incidents, satisfaction and EBITDA by unit.
088. Execution phases
Initial audit, diagnosis, improvement levers, action plan, prioritised implementation, indicator tracking and executive adjustment.
099. Required documentation
Sales history, operating costs, staffing, pricing, POS reports, reservation data, incidents and available reviews or surveys.
1010. Deliverables
Diagnostic report, improvement levers, prioritised plan, KPI framework, executive follow-up and transformation recommendations.
1111. Decisions enabled
Change prices, resize hours and staffing, reorder activity mix, improve sales processes, reduce costs and decide corrective investments.
1212. Risks analysed
Revenue actions that damage margin, cost reductions that harm experience, incomplete indicators and weak adoption by teams.
1313. Collaboration models
Standalone audit, improvement plan with follow-up, phased transformation or temporary external direction.
1414. Limits and exclusions
It does not replace financial audit, labour, tax or legal advice.
1515. Applications by leisure format
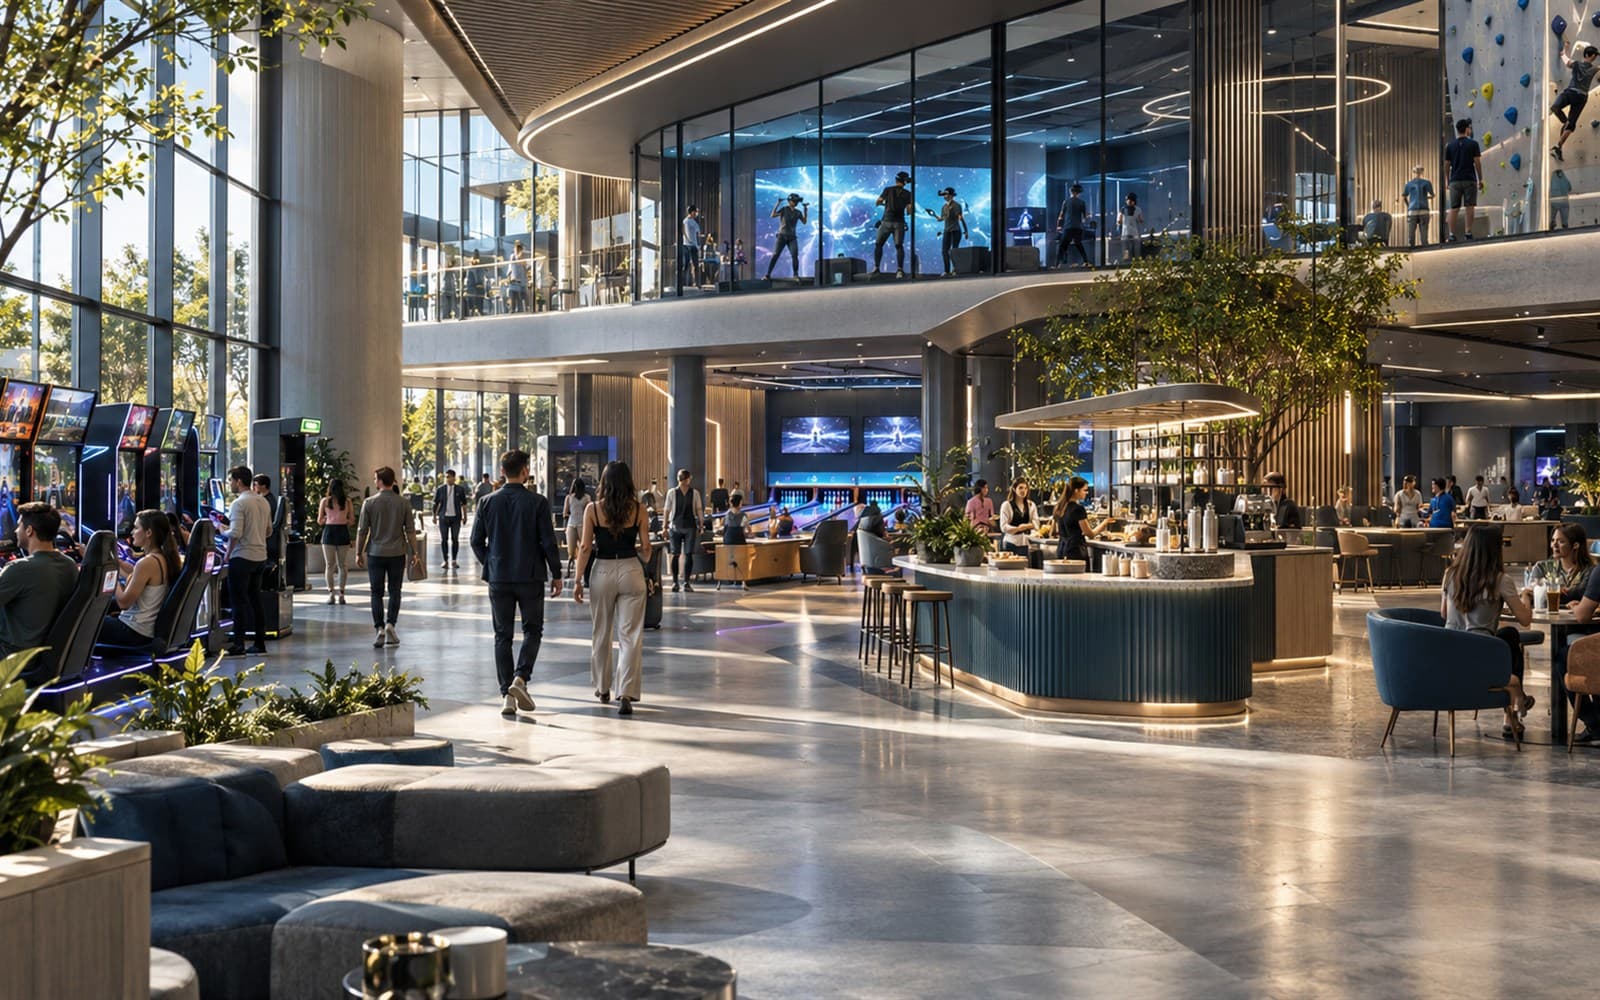
Multi-activity indoor centres, arcade/redemption, bowling, F&B, events, birthdays and social gaming.
1616. FAQs
Are complete data required?
Not always. Missing data are identified and a minimum measurement system can be built.
1717. CTA
Primary: Optimise an existing business.
Secondary: Request an operating audit.
Next step
Optimise an existing business
Describe the context and we will prepare a qualified conversation about the opportunity.